For nearly two years, the gold market appeared invincible. Driven by a “perfect storm” of geopolitical chaos, relentless central bank accumulation, and a weakening U.S. dollar, the yellow metal staged a parabolic rally that culminated in an eye-watering peak of nearly $5,600 per ounce in late January 2026.
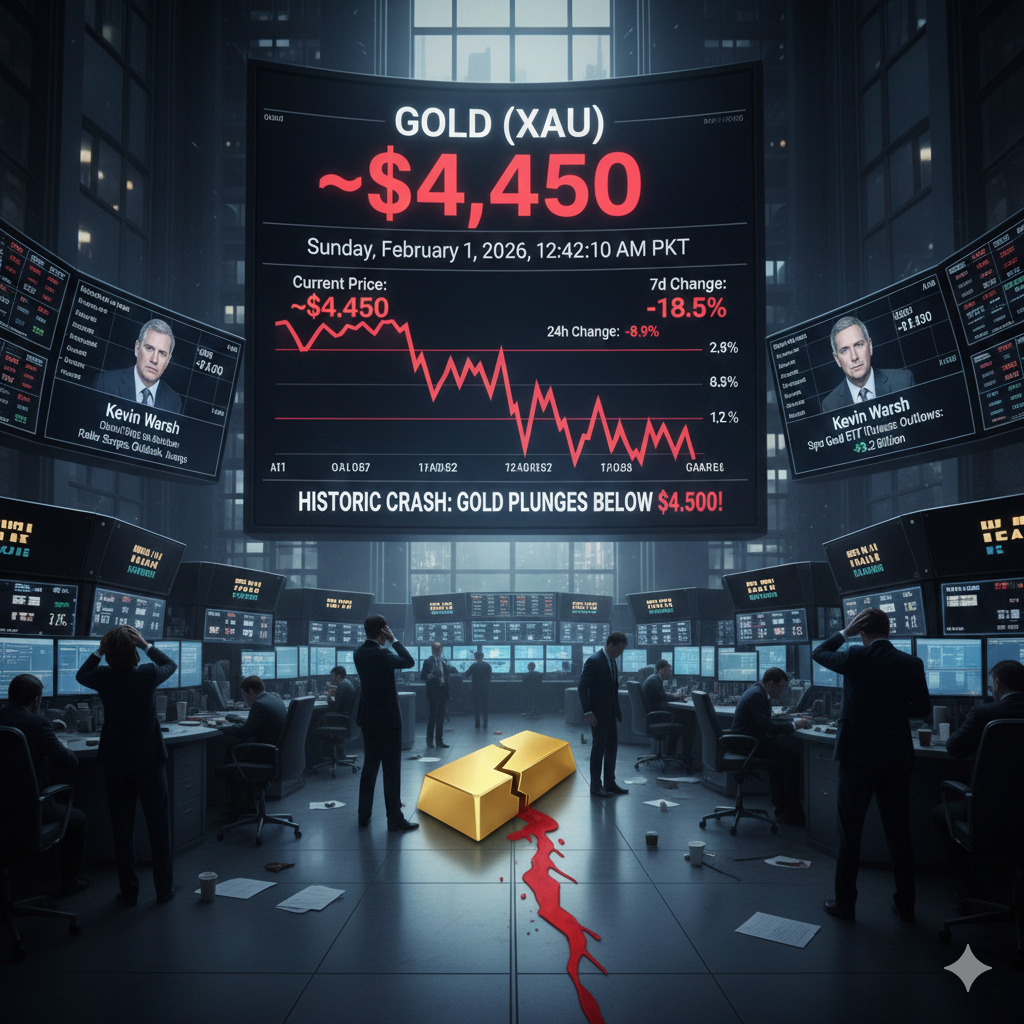
But on Friday, January 30, 2026, the music stopped. In a single, violent trading session, gold prices cratered, shedding nearly 9% of their value and dragging silver down in a 30% “flash crash” reminiscent of the 1980s. This correction has sent shockwaves through global markets, erasing over $5 trillion in market capitalization across the precious metals sector.
What triggered this sudden “discovery of gravity”? Is the decade-long bull run finally over, or is this merely a “healthy” correction in an overheated market?
1. The “Warsh Shock”: A New Era for the Federal Reserve
The primary catalyst for the gold price crash was a major shift in the American political and monetary landscape. On Friday morning, President Donald Trump officially nominated former Federal Reserve Governor Kevin Warsh to succeed as the next Fed Chair.
The market’s reaction was instantaneous. Warsh, known for his hawkish stance on inflation and his advocacy for a smaller Fed balance sheet, is perceived as a “hard money” candidate. His nomination immediately:
- Strengthened the U.S. Dollar: The DXY (Dollar Index) surged by nearly 1%, making gold—which is priced in dollars—significantly more expensive for international buyers.
- Crushed Easing Hopes: Investors quickly repriced their expectations for interest rate cuts in 2026. As “higher-for-longer” rates became the baseline scenario again, the opportunity cost of holding non-yielding gold skyrocketed compared to high-yielding Treasury bonds.
2. Technical Exhaustion and “Overbought” Signals
From a technical perspective, gold was a ticking time bomb. By the third week of January, almost every momentum indicator—from the Relative Strength Index (RSI) to the Moving Average Convergence Divergence (MACD)—was screaming “overbought.”
- Parabolic Failure: Prices had risen too far, too fast, detached from their 50-day and 200-day moving averages.
- The $5,000 Support Breach: When gold dipped below the psychologically critical $5,000 level, it triggered a massive “cascade” of stop-loss orders and automated sell programs.
- Institutional Liquidation: Large-scale institutional players, including the SPDR Gold Trust, reported selling significant tonnage in a single day to lock in profits after a 65% gain in 2025.
3. The “Sell Everything” Liquidity Crunch
Surprisingly, the gold drop was also fueled by weakness in other sectors. Earlier in the week, six of the “Magnificent Seven” AI-related tech stocks faced a brutal selloff. This created a liquidity squeeze where hedge funds were forced to liquidate their winning gold positions to meet margin calls on their losing equity and cryptocurrency trades. In the world of high-finance, when things get “bloody,” investors often sell what they can (gold), not necessarily what they want to.
Technical Support Levels: Where is the Bottom?
Analysts are now scanning the charts for “safe” entry points. While the immediate momentum is bearish, the structural uptrend is still arguably intact.
| Support Level | Significance |
| $4,850 – $4,900 | Immediate consolidation zone; bears are currently testing this floor. |
| $4,640 | The “1:1 Geometry” boundary; a break below this signals a true trend reversal. |
| $4,360 | The 50-day EMA. This is the “Holy Grail” for structural bulls. If held, the bull market remains healthy. |
| $3,800 | The 200-day Moving Average; the ultimate line in the sand between a bull and bear market. |
The Silver Lining: Why Gold Isn’t Dead Yet
Despite the carnage, many analysts—including those at Goldman Sachs and J.P. Morgan—believe this is a “buying opportunity” rather than a permanent exit. Several long-term “structural drivers” remain in place:
- Central Bank Diversification: Emerging market central banks (like Poland and China) are still significantly “underweight” gold compared to Western nations. They are expected to buy roughly 60–80 tonnes per month through 2026 to diversify away from the dollar.
- Geopolitical Resilience: While Iran has signaled a willingness for dialogue, the underlying tensions in the Middle East and the South China Sea remain unresolved. Gold thrives on this uncertainty.
- Fiscal Deficits: The U.S. sovereign debt trajectory remains a long-term concern. Gold remains the only asset that isn’t someone else’s liability.
Conclusion: A Reality Check for Investors
The February 2026 gold crash is a stark reminder that even the strongest bull markets “rediscover gravity.” For retail investors, the lesson is clear: chasing a parabolic rally without a risk-management plan is a recipe for disaster.
However, for the patient investor, a correction toward the $4,400–$4,600 range could offer a generational entry point. As Goldman Sachs recently updated their year-end target to $5,400, the current dip may just be the necessary “breather” before gold attempts its next run toward $6,000